This post is a continuation of the best long-term historical charts for Bitcoin and consequently the rest of the digital asset market. We looked at charts to help us identify times when Bitcoin has potentially bottomed and when we confirm the end of the bear market and the start of a new bull market. Pretty valuable stuff. Let’s now look at the best ways to identify times when Bitcoin is nearing a top and the end of a bull market follows.
Identifying Bitcoin Tops
Let’s say we’re in a bull market and we want to be wary when a Bitcoin topping pattern might be taking place. This awareness will be helpful when we’ve been invested for a couple of years and are either looking for a good time to exit and take profits or when we simply want to monitor the overall state of the market to later add to long-term positions. Before looking at these charts, we first need to learn a little more about RSI and divergence.
Understanding RSI and Divergence
The relative strength index (RSI) is a technical analysis indicator that measures the momentum of an asset and shows when it is relatively oversold or overbought. A reading above 70 indicates that the asset is overbought and a reading below 30 indicates that it’s oversold.
In Bitcoin’s latest topping pattern in the most recent market cycle, it registered a new high in price of $68,900 on November 10, 2021, while at the same time putting in a third consecutive lower high on the weekly RSI at 68. Why is this significant and what can we learn from it?
Bitcoin’s 2021 market cycle top was a textbook example of what’s called bearish price and RSI divergence (or simply ‘bearish divergence’) on both the weekly and monthly time frames. Many sophisticated traders, investors, and institutions look for this type of bearish divergence when selling any asset and looking to take profits.
Bearish divergence simply means that the price of an asset makes a new high, but the RSI indicator registers a lower high. Remember that RSI measures the momentum or relative strength of a trend. So, you can think of bearish divergence as an excellent signal that momentum is slowing in an uptrend and a reversal is imminent. It’s a powerful topping indicator on the weekly chart and an even more powerful indicator on the monthly chart.
If you go on TradingView and look at any major stock index, you’ll be able to spot bearish divergence on the weekly and monthly charts right before any of the major market corrections.
In our market, look at the first sign of bearish divergence on the weekly chart for Bitcoin for our most recent cycle.
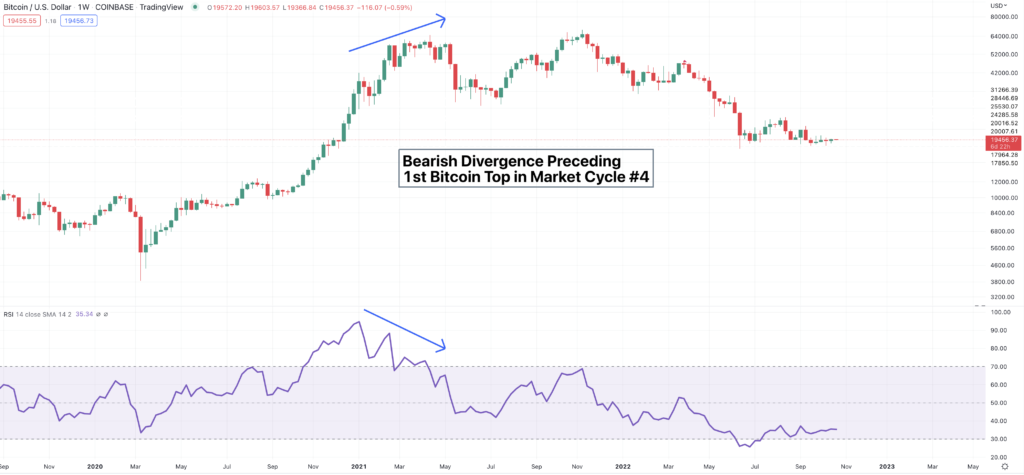
This was the first major warning sign. But look at the even more powerful bearish divergence that took place several months later.
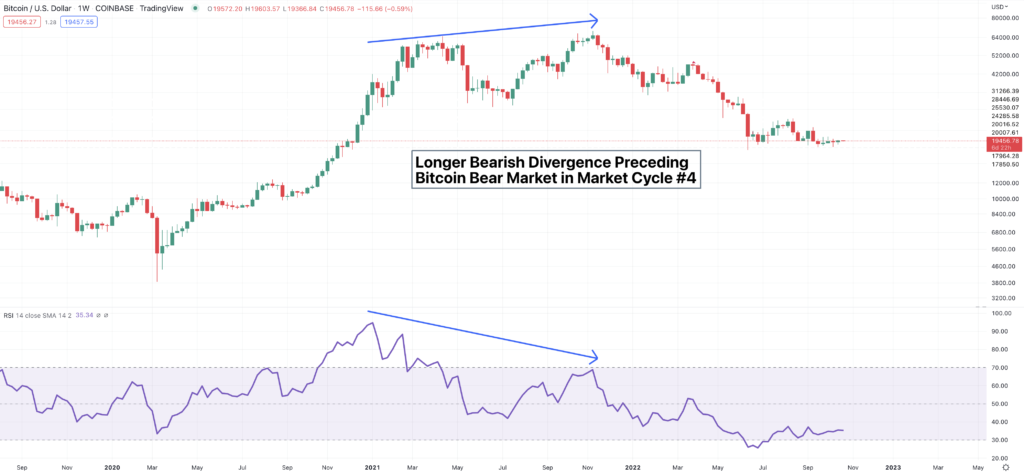
Notice how Bitcoin made a higher high in price while setting lower highs in the RSI indicator.
Now that you understand more about RSI and the potency of bearish divergence, we can progress to our first long-term chart for spotting a top in Bitcoin. For this, we’ll use the monthly chart for Bitcoin along with the RSI. In order to identify Bitcoin tops, there are two things to consider, which you’ll see in this next image.
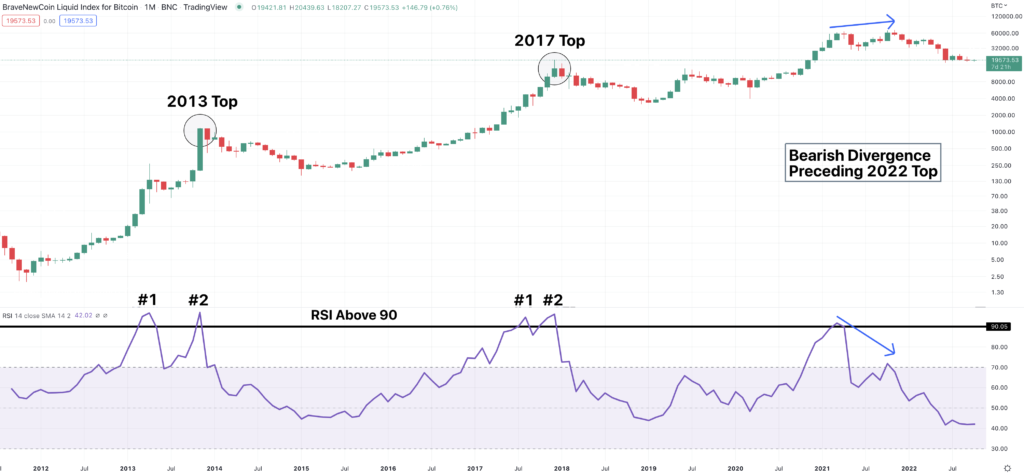
- In the previous cycles, Bitcoin topped when the monthly RSI registered 90 or above for the second time.
- In our most recent cycle, there was bearish divergence on the monthly time frame (Bitcoin’s price registered a new high but the RSI registered a lower high).
We’ll want to be cognizant of either of these two signals emerging in our next market cycle.
Ok, let’s stop there. We’re now equipped with some of the most powerful knowledge to be a successful long-term investor in this market: the best ways to spot Bitcoin topping patterns. If your goal is to simply buy and hold, that’s great. This knowledge will help you better understand optimal times to stop accumulating and look for better buying opportunities in the following months.
Like always, these posts are just a sample of the content that’s in The Modern Investor. If you want access to more in-depth historical charts like this, feel free to check it out on Amazon.
Thanks for reading! If you enjoyed this, you can check out the other articles and don’t forget to follow me on Twitter @andrewdfarrar for up-to-date crypto content. In these crazy times, it’s never been a more important time to learn about this new asset class.