Historical charts

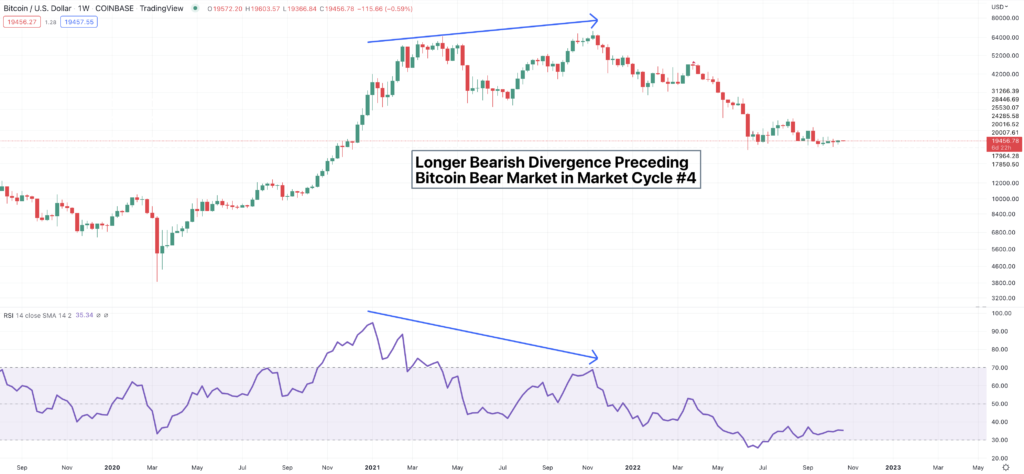
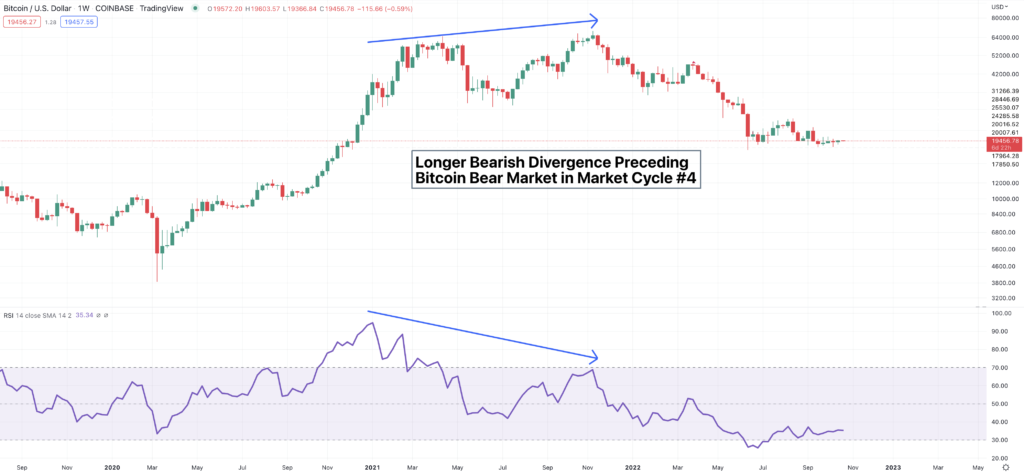
Understanding RSI and Bullish and Bearish Divergence

In this post, we’ll learn about an important technical indicator (RSI) that is very helpful for building our knowledge base of technical analysis. After defining the indicator, we’ll explore how we can use it on long-term charts to spot significant trend changes by using something called divergence. Let’s dive in! What is the RSI? The …

Understanding RSI and Bullish and Bearish Divergence Read More »

The Best Long-Term Bitcoin Historical Charts: Part 3

In our last post of the three-part historical charts series, we’ll be examining a helpful chart that signals when a crypto bull market is over and lets us know when to prepare for the next long bear market. There are a bunch more of these types of helpful charts in The Modern Investor that really …

The Best Long-Term Bitcoin Historical Charts: Part 3 Read More »

The Best Long-Term Bitcoin Historical Charts: Part 2

This post is a continuation of the best long-term historical charts for Bitcoin and consequently the rest of the digital asset market. We looked at charts to help us identify times when Bitcoin has potentially bottomed and when we confirm the end of the bear market and the start of a new bull market. Pretty …

The Best Long-Term Bitcoin Historical Charts: Part 2 Read More »

The Best Long-Term Bitcoin Historical Charts: Part 1

In this post, we’ll get into the best long-term investing charts for Bitcoin and consequently the rest of the digital asset market. As always, this is just a small sample of what I write about in my book, The Modern Investor. I can’t give away all the secrets! So if you enjoy this content, feel …

The Best Long-Term Bitcoin Historical Charts: Part 1 Read More »