In this post, we’ll learn about an important technical indicator (RSI) that is very helpful for building our knowledge base of technical analysis. After defining the indicator, we’ll explore how we can use it on long-term charts to spot significant trend changes by using something called divergence. Let’s dive in!
What is the RSI?
The relative strength index (RSI) is a technical analysis indicator that measures the momentum of an asset and shows when it is relatively oversold or overbought. A reading above 70 indicates that the asset is overbought and a reading below 30 indicates that it’s oversold.
In Bitcoin’s latest topping pattern in the most recent market cycle, it registered a new high in price of $68,900 on November 10, 2021, while at the same time putting in a third consecutive lower high on the weekly RSI at 68. Why is this significant and what can we learn from it?
What is Bearish Divergence?
Bitcoin’s 2021 market cycle top was a textbook example of what’s called bearish price and RSI divergence (or simply ‘bearish divergence’) on both the weekly and monthly time frames. Many sophisticated traders, investors, and institutions look for this type of bearish divergence when selling any asset and looking to take profits.
Bearish divergence simply means that the price of an asset makes a new high, but the RSI indicator registers a lower high.8 Remember that RSI measures the momentum or relative strength of a trend. So, you can think of bearish divergence as an excellent signal that momentum is slowing in an uptrend and a reversal is imminent. It’s a powerful topping indicator on the weekly chart and an even more powerful indicator on the monthly chart.
To show you what I mean, let’s look at the last major bear markets for the S&P 500. We’ll be looking at the weekly chart. Notice the bearish divergence in price action and RSI that preceded these market corrections.
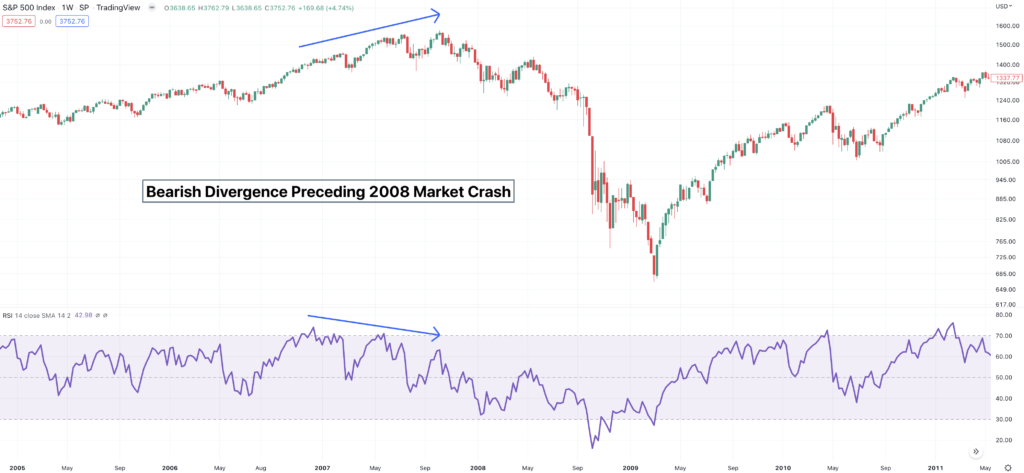
On top, you can see that the price of the S&P 500 index made higher highs (as indicated by the upward sloping arrow). But on the bottom of the chart in purple, the RSI made lower highs at the same time (downward sloping arrow). This is a textbook example of significant bearish divergence. How about our most recent correction?

Same exact thing. Price made higher highs, but RSI made lower highs. Bearish divergence. This helps us as investors because bearish divergence signals a major trend reversal. Let’s look at Bitcoin’s topping pattern in our most recent market cycle.

This was the first MAJOR warning sign. Bitcoin displayed bearish divergence on the weekly chart. Then what happened?
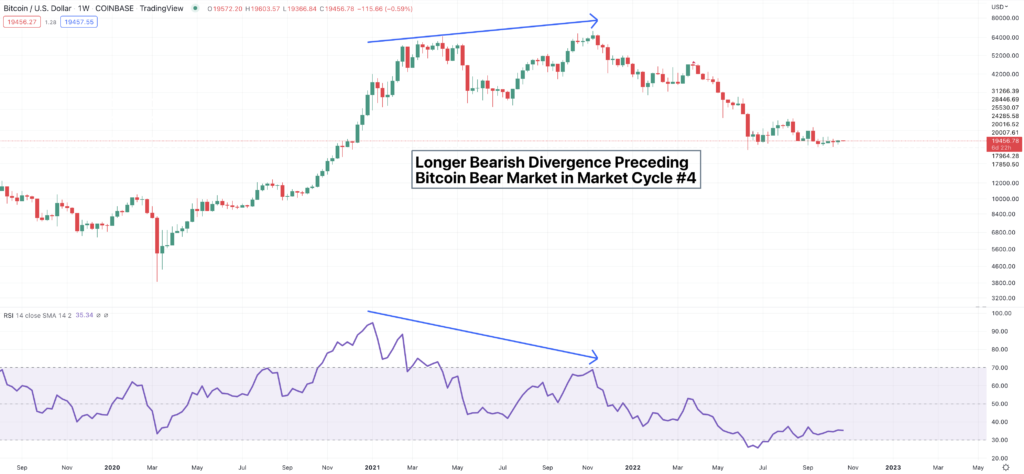
After the first major correction in Bitcoin’s price, a new higher high was set. This created an even LONGER and hence more significant bearish divergence. See how the upward sloping arrow showed higher highs in price, but the downward sloping arrow signaled lower high in RSI? This was an enormous warning sign for investors who understand bearish divergence and trend reversals. This led straight to the most recent bear market for digital assets that we’re currently in.
What is Bullish Divergence?
Just the opposite, bullish divergence occurs when the price of an asset makes a lower low, but the RSI registers a higher low. This indicates the momentum of the downtrend is slowing dramatically and poised for a major reversal. We’ll have to keep an eye on Bitcoin’s price action as this bear market continues to see if we spot any significant bullish divergence that might signal an incoming reversal and the beginning of the end the down trend.
Thanks for reading! If you enjoyed this, check out the other articles and don’t forget to follow me on Twitter @andrewdfarrar for up-to-date crypto content. In these crazy times, it’s never been a more important time to learn about this new asset class.